- Free 14-day trial
- 1 000 logged errors per month
- 1 000 log API calls per month
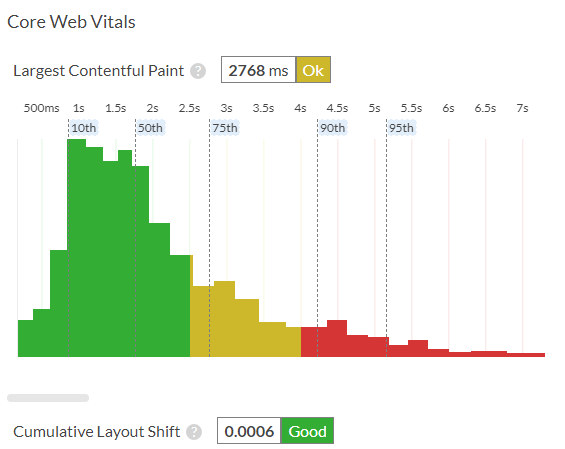
- Performance metrics for 100 URLs
- Time on page for 100 URLs
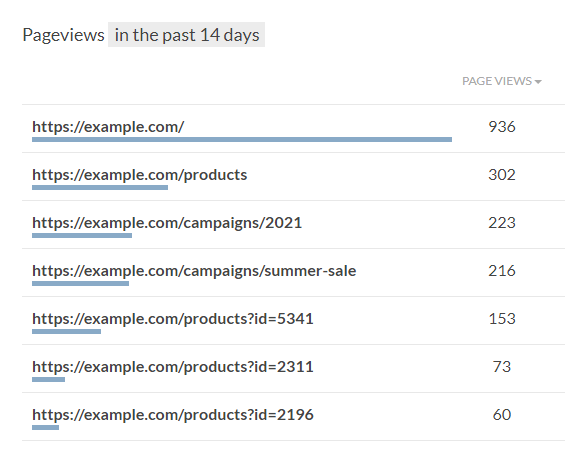
- Pageviews for 10 000 URLs
- 1 domain per account ?Your account will be able to log from 1 domain, and an unlimited number of subdomains of that domain.
If you set up logging from example.com, you can also log from *.example.com. - Email notifications
- Screenshots
- Click trails
- Priority support
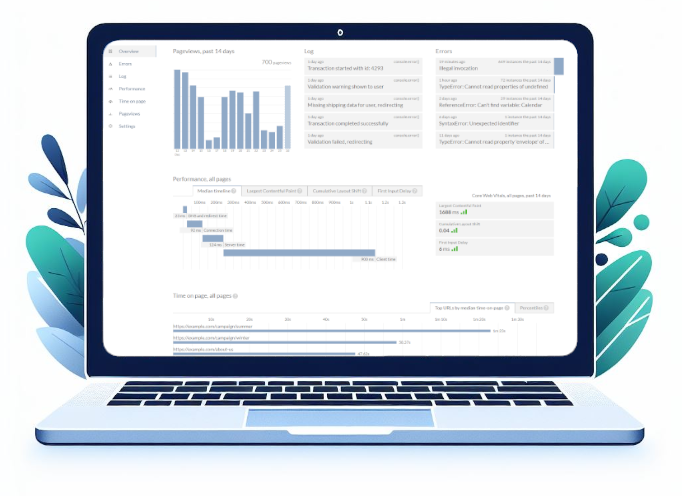
Know when your website breaks.
Discover bugs and performance problems with one tiny addition.