We rendered a million web pages to find out what makes the web slow
- Why render a million web pages?
- Overall numbers
- What makes the web slow: Predicting time-to-interactive
- What is the effect of HTTP protocol version on dominteractive?
- What is the effect of type of content on dominteractive?
- Takeaways
- Libraries
- Top 10 libraries by usage
- Predicting time-to-interactive from library use
- The best and the worst libraries for time-to-interactive, by regression coefficients
- The best and the worst libraries for onload time, by regression coefficients
- The best and the worst libraries for jsheapusedsize, by regression coefficients
We rendered the top 1 million pages on the web, tracking every conceivable performance metric, logging every error, noting every requested URL. To our knowledge this produces the first dataset that connects performance, errors, and library use on the web. In this article we analyze what the data can tell us about creating high performance web sites.
Can you do better than our analysis? We published the dataset to Kaggle, so you can crunch the numbers yourself.
Why render a million web pages?
A common sentiment these days is that the web is somehow slower and buggier than it was 15 years ago. Because of an ever-growing pile of JavaScript and frameworks and webfonts and polyfills, we've eaten up all the gains that faster computers, networks and protocols have given us. Or so the argument goes. We wanted to check if this was actually true and try to find what common factors are causing slow and broken websites in 2020.
The high level plan was simple: Scripting a web browser, having it render the root page of the top 1 million domains, and logging every conceivable metric: render times, request counts, repaints, JavaScript errors, libraries used, etc. With all this data, we can ask questions about how one factor correlates with another. What factors contribute most to slow render times? Which libraries are correlated with long time-to-interactive? What are the most common errors, and what's causing them?
Gathering the data was a matter of writing a bit of code to use Puppeteer to script Chrome, firing up 200 EC2 instances, rendering a million web pages over the weekend, and praying that you've actually understood how AWS pricing works.
Overall numbers
HTTP 2 is now more common than HTTP 1.1, but HTTP 3 is still rare. (Note: We're counting anything using the QUIC protocol as HTTP 3, even if Chrome sometimes reports this as HTTP 2 + QUIC.) This was for the root document, for linked resources the protocol numbers look a bit different.
For linked resources, HTTP 3 is about 100x more prevalent. How can this be true? Because all the sites are linking the same stuff:
There's a handful of scripts that are linked on a large portion of web sites. This means we can expect these resources to be in cache, right? Not any more: Since Chrome 86, resources requested from different domains will not share a cache. Firefox is planning to implement the same. Safari has been splitting its cache like this for years.
What makes the web slow: Predicting time-to-interactive
Given this dataset of web pages and their load time metrics, it would be nice to learn something about what it is that makes web pages slow. We'll investigate the dominteractive metric, which is the time it takes before the document becomes interactive to the user. The simplest thing we could do is just to look at the correlation of each metric with dominteractive.
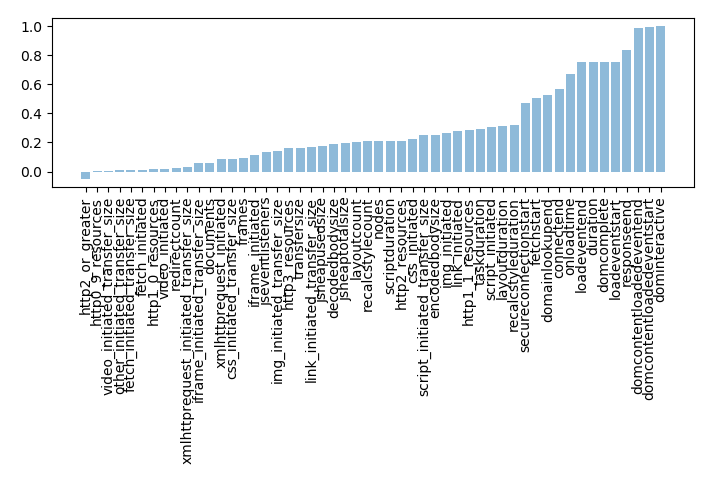
Correlations of metrics with dominteractive
Essentially every metric is positively correlated with dominteractive, except the 0-1 variable indicating HTTP2 or greater. Many of these metrics are also positively correlated with each other. We need a more sophisticated approach to get at individual factors contributing to a high time-to-interactive.
Some of the metrics are timings, measured in milliseconds. We can look at their box-plot to get an idea of where browsers are spending their time.
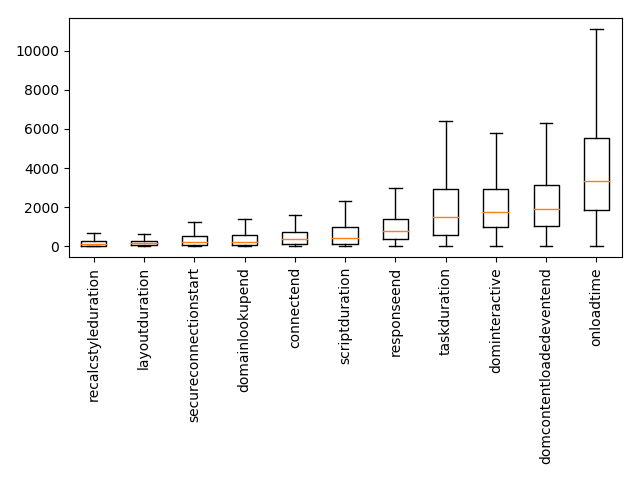
Box-plot of timing metrics. The orange line is the median, the box goes from the 25th to the 75th percentile.
One way to get at the individual factors contributing to a high time-to-interactive is to do a linear regression, where we predict dominteractive from other metrics. That means we assign a weight to each metric and model the dominteractive time of a page as the weighted sum of the other metrics, plus some constant. An optimization algorithm sets the weights so as to minimize the prediction error over the whole dataset. The size of the weights found by the regression tells us something about how much each metric contributes to the slowness of the page.
We'll exclude timing metrics from the regression. If we spend 500ms establishing a connection, that adds 500ms to dominteractive, but this is not a particularly interesting insight. Timing metrics are fundamentally outcomes. We want to learn what causes them.
The numbers in parenthesis are the regression coefficients learned by the optimization algorithm. You can interpret these as having units of milliseconds. While the exact numbers should be taken with a grain of salt (see note below), it is interesting to see the scale assigned to each feature. For example, the model predicts a 354ms slow down for every redirect needed to deliver the main document. Whenever the main HTML document is delivered via HTTP2 or higher, the model predicts a 477ms lower time-to-interactive. For each request triggered by the document, it predicts an additional 16 ms.
What is the effect of HTTP protocol version on dominteractive?
Here's a fun plot of dominteractive split by the HTTP protocol version used to deliver the root HTML page.
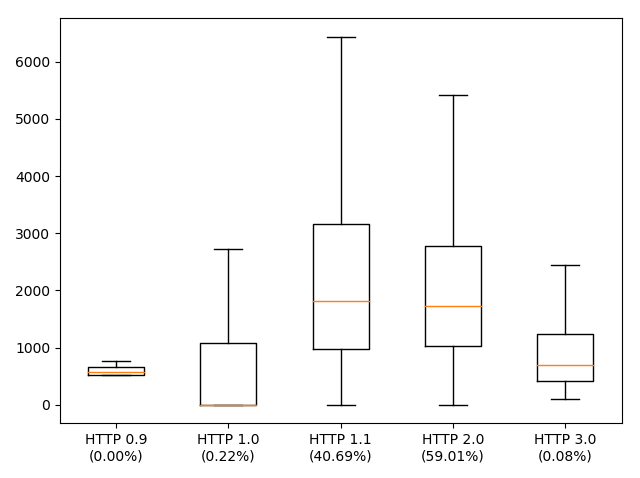
Box-plot of dominteractive split by HTTP protocol version of the first request. The orange line is the median, the box goes from the 25th to the 75th percentile. The percentages in parenthesis are the fraction of requests made with this protocol.
There's a tiny number of sites still delivered over HTTP 0.9 and 1.0. And these sites happen to be fast. It seems we can't disentangle the fact that protocols have gotten faster with the effect that programmers will happily consume this speed-up by delivering more stuff to the browser.
This is for the protocol version used to deliver the root HTML page. What if we look at the effect of the protocol for resources linked in that document? If we do a regression on number of requests by protocol version, we get the following.
If we were to believe this, we would conclude that moving requested resources from HTTP 1.1 to 2 gives a 1.8x speed-up, while going from HTTP 2 to 3 causes 0.6x slow down. Is it really true that HTTP 3 is a slower protocol? No: A more likely explanation is that HTTP 3 is rare, and that the few resources that are being sent over HTTP 3 (e.g. Google Analytics) are things that have a larger than average effect on dominteractive.
What is the effect of type of content on dominteractive?
Let's predict time-to-interactive from the number of bytes transferred, split by the type of data being transferred.
Here's a similar regression, this time looking at the number of requests per request initiator type.
Here the requests are split up by what initiated the requests. Clearly, not all requests are made equal. Requests triggered by the link element (i.e. CSS, favicons) and requests triggered by CSS (i.e. fonts, more CSS) and scripts and iframes slow things down considerably. Doing requests over XHR and fetch are predictive of a faster than baseline dominteractive time (likely because these requests are almost always async). CSS and scripts are often loaded in a render-blocking way, so it is no surprise to find them associated with slower time-to-interactive. Video is comparatively cheap.
Takeaways
We haven't uncovered any new optimization tricks here, but the analysis does give an idea of the scale of the impact one can expect from various optimizations. The following claims seem to have good empirical backing:
- Make as few requests as you can. Number of requests matters more than number of kilobytes transferred.
- For the request you have to make, do them over HTTP2 or greater if you can.
- Strive to avoid render blocking requests when you can, prefer async loading when possible.
Libraries
To figure out what libraries are in use on a page, we took the following approach: On every site we noted the global variables (i.e. the properties on the window object). Afterwards, every global variable with more than six thousand appearances were associated (where possible) with a JavaScript library. This is a painstaking undertaking, but since the dataset also has the requested URLs for every page it was possible to look at the overlap between variable occurrences and URL requests, which would often be enough to identify which library would set each global variable. Global variables that could not be confidently associated with a single library were ignored. This methodology will undercount to some extent: JS libraries have no obligation to leave anything in the global namespace. It will also have some noise, whenever different libraries set the same property, and this fact was missed during labeling.
What are the most common JavaScript libraries in use today? Going by the topics of conferences and blog posts, you'd be excused for suggesting React, Vue and Angular. In this ranking they are nowhere near the top.
Top 10 libraries by usage
View full list of libraries by use
Yes, good old jQuery is at the top. JQuery was first released in 2006, which is 14 years ago in human years, but much longer in JavaScript years. Measured in Angular versions, it is probably hundreds of versions ago. 2006 was a different time. The most used browser was called Internet Explorer 6, the largest social network was MySpace, and rounded corners in web pages were such a revolution that people called it web 2.0. JQuery's primary use case was cross-browser compatibility, which is a different beast in 2020 than it was in 2006. Still, 14 years later, a full half of the web pages in our sample loaded jQuery.
Funnily enough, 2.2% of the websites threw an error because JQuery was not loaded.
Judging by this top 10, our browsers are mostly running analytics, ads, and code to be compatible with old browsers. Somehow 8% of web sites define a setImmediate/clearImmediate polyfill for a feature that isn't on track to be implemented by any browser.
Predicting time-to-interactive from library use
We'll again run a linear regression, predicting dominteractive from the presence of libraries. The input to the regression is a vector X, with X.length == number of libraries, where X[i] == 1.0 if library i is present, X[i] == 0.0 if it is not. Of course, we know that dominteractive is not actually determined by the presence or absence of certain libraries. However, modeling each library as having an additive contribution to slowness, and regressing over hundreds of thousands of examples still leaves us with interesting findings.
The best and the worst libraries for time-to-interactive, by regression coefficients
Top 5 libraries, time-to-interactive
Bottom 5 libraries, time-to-interactive
View full list of libraries by regression coefficients predicting dominteractive
The negative coefficients here mean that the model predicts a lower time-to-interactive when those libraries are present than it does when no libraries are present. Of course, it doesn't mean that adding those libraries will make your site faster, it only means that the sites with those libraries happen to be faster than some baseline that the model has established. The results here may be as much sociological as they are technical. For example, libraries for lazy-loading predict low time-to-interactive. This may be just as much because pages with these libraries are made by programmers who spent time optimizing for fast page loads as it is directly caused by lazy-loading. We can't untangle these factors with this set-up.
The best and the worst libraries for onload time, by regression coefficients
We can repeat the exercise above, but this time predicting onloadtime. Onloadtime is the time it takes for the window's "load" event to fire, which is the time it takes for all resources on the page to load. We do a linear regression in the same way as before.
Top 5 libraries, onload time
Bottom 5 libraries, onload time
View full list of libraries by regression coefficients predicting onloadtime
The best and the worst libraries for jsheapusedsize, by regression coefficients
Here the prediction is the heap size used by JavaScript, in megabytes.
Top 5 libraries, low jsusedheapsize
Bottom 5 libraries, high jsusedheapsize
View full list of libraries by regression coefficients predicting jsheapusedsize
Internet commentators are fond of saying that correlation does not equal causation, and indeed we can't get at causality directly with these models. Great caution should be exercised when interpreting the coefficients, particularly because a lot confounding factors may be involved. However, there's certainly enough there to make you go "hmm". The fact that the model associates a 982ms slower time-to-interactive with the presence of jQuery, and that half of the sites load this script should give us some concern. If you're optimizing your own site, cross-referencing its list of dependencies with the ranks and coefficients here should give you a decent indicator of which dependency removal can get you the most bang for your buck.